Best time to cruise · Best time to go
Iceland, Greenland & the Arctic cruises in July
The warmest month, with Reykjavík highs around 57°F (14°C) and Akureyri sometimes warmer. Sea ice retreats around Svalbard, opening circumnavigation routes, and icebergs crowd Disko Bay off Ilulissat. Humpback and minke whales feed off northern Iceland, and puffin colonies are at their busiest.
- Best time to go
- Avg high 53°F
- 21 hrs daylight
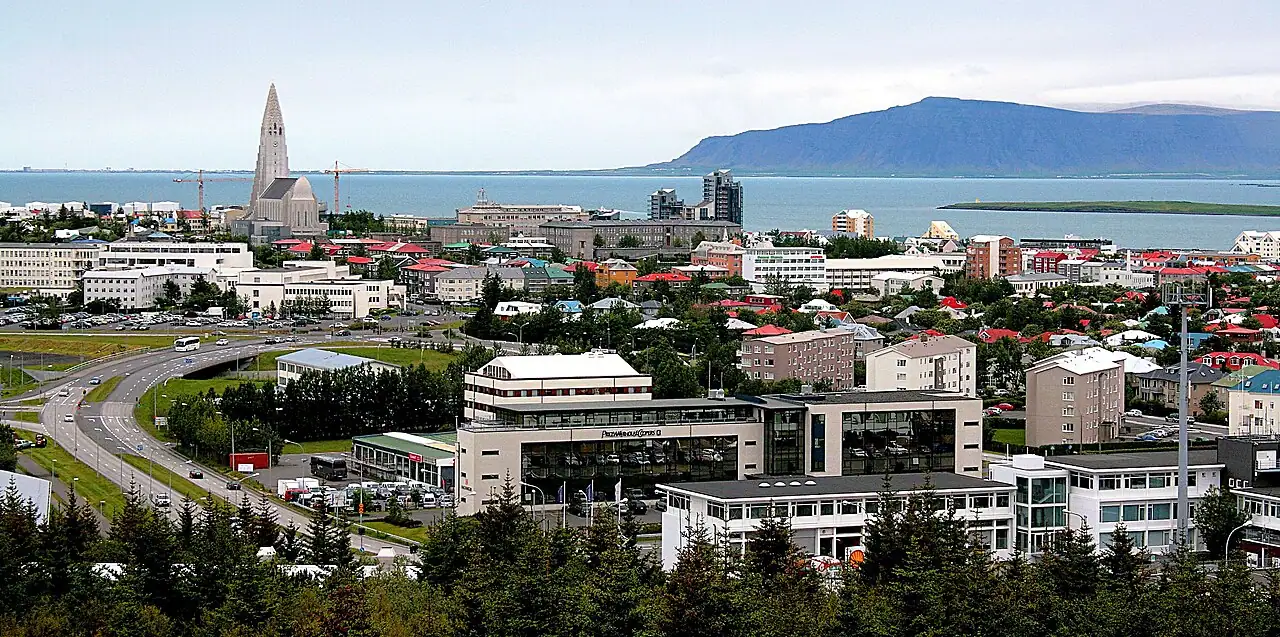
Photo: Hedwig Storch, CC BY-SA 3.0, via Wikimedia Commons
Iceland, Greenland & the Arctic in July: Best time to go
The warmest month, with Reykjavík highs around 57°F (14°C) and Akureyri sometimes warmer. Sea ice retreats around Svalbard, opening circumnavigation routes, and icebergs crowd Disko Bay off Ilulissat. Humpback and minke whales feed off northern Iceland, and puffin colonies are at their busiest.
Across Iceland, Greenland & the Arctic cruise ports, July brings average highs around 53°F (12°C) and lows near 46°F, with about 3.3 inches of rain over the month and roughly 21 hours of daylight.
- Verdict
- Best time to go
- Season
- Late May to September; Greenland and Svalbard mainly June to August
- Average high / low
- 53°F / 46°F
- Rainfall (month)
- 3.3 in
- Daylight
- About 21 hours
- Typical cruise length
- 7–10 nights around Iceland; 12–16 nights from Europe; 10–14-night Arctic expeditions
What to pack: layers you can add and remove: long pants, a warm fleece or sweater, a waterproof jacket and closed walking shoes.
How July compares with the rest of the year
- Jan: No regular sailings
- Feb: Shoulder season
- Mar: Shoulder season
- Apr: No regular sailings
- May: Shoulder season
- Jun: Best time to go
- Jul: Best time to go
- Aug: Best time to go
- Sep: Good time to go
- Oct: Shoulder season
- Nov: No regular sailings
- Dec: No regular sailings
- No regular sailings
- Shoulder season
- Good time to go
- Best time to go
Iceland, Greenland & the Arctic weather in July
| Month | Jan | Feb | Mar | Apr | May | Jun | Jul | Aug | Sep | Oct | Nov | Dec |
|---|---|---|---|---|---|---|---|---|---|---|---|---|
| High °F (°C) | 28-2 | 28-2 | 29-1 | 352 | 415 | 499 | 5312 | 5211 | 478 | 394 | 341 | 30-1 |
| Low °F (°C) | 21-6 | 20-7 | 21-6 | 27-3 | 341 | 415 | 468 | 457 | 405 | 331 | 28-2 | 24-5 |
| Rain in (mm) | 3.998 | 3.794 | 3.588 | 2.973 | 3.076 | 3.281 | 3.385 | 3.794 | 4.5113 | 4.2107 | 3.896 | 4.1105 |
| Daylight (hrs) | 4 | 7 | 11 | 16 | 20 | 23 | 21 | 18 | 13 | 9 | 5 | 3 |
July weather port by port
| Port | Avg high | Avg low | Rain | Daylight |
|---|---|---|---|---|
| Reykjavík | 57°F | 48°F | 3.3 in | 20 h |
| Akureyri | 55°F | 46°F | 4.0 in | 21 h |
| Ísafjörður | 53°F | 45°F | 3.5 in | 21 h |
| Seyðisfjörður | 52°F | 46°F | 4.0 in | 20 h |
| Tórshavn, Faroe Islands | 53°F | 50°F | 3.1 in | 19 h |
| Ilulissat | 52°F | 42°F | 2.2 in | 24 h |
| Nuuk | 47°F | 42°F | 3.0 in | 20 h |
| Longyearbyen, Svalbard | 45°F | 40°F | 2.3 in | 24 h |
| Tromsø | 64°F | 51°F | 4.5 in | 24 h |
Average daily highs and lows, 2015–2024, from NASA POWER, adjusted to sea level. Rain is the average monthly total.
Other great cruise destinations in July
Iceland, Greenland & the Arctic in July: FAQs
Is July a good time to cruise Iceland, Greenland & the Arctic?
Yes, it's one of the best months. The warmest month, with Reykjavík highs around 57°F (14°C) and Akureyri sometimes warmer. Sea ice retreats around Svalbard, opening circumnavigation routes, and icebergs crowd Disko Bay off Ilulissat. Humpback and minke whales feed off northern Iceland, and puffin colonies are at their busiest.
What is the weather like on a Iceland, Greenland & the Arctic cruise in July?
Across Iceland, Greenland & the Arctic cruise ports, July brings average highs around 53°F (12°C) and lows near 46°F, with about 3.3 inches of rain over the month and roughly 21 hours of daylight. Conditions vary from port to port and day to day.
What should I pack for a Iceland, Greenland & the Arctic cruise in July?
Pack layers you can add and remove: long pants, a warm fleece or sweater, a waterproof jacket and closed walking shoes. Check your cruise line's dress code for evenings.
When is the best time to cruise Iceland, Greenland & the Arctic?
Late May to September; Greenland and Svalbard mainly June to August. The best months are usually June, July, August.
Where else can I cruise in July?
July is also a top month for Bermuda, Alaska, Canada & New England, Northern Europe, Norwegian Fjords.
Updated November 2026 by the BookMyDreamCruise editorial team. How we research and fact-check.
Sources: NASA POWER climate data.