Best time to cruise · Best time to go
Antarctica cruises in February
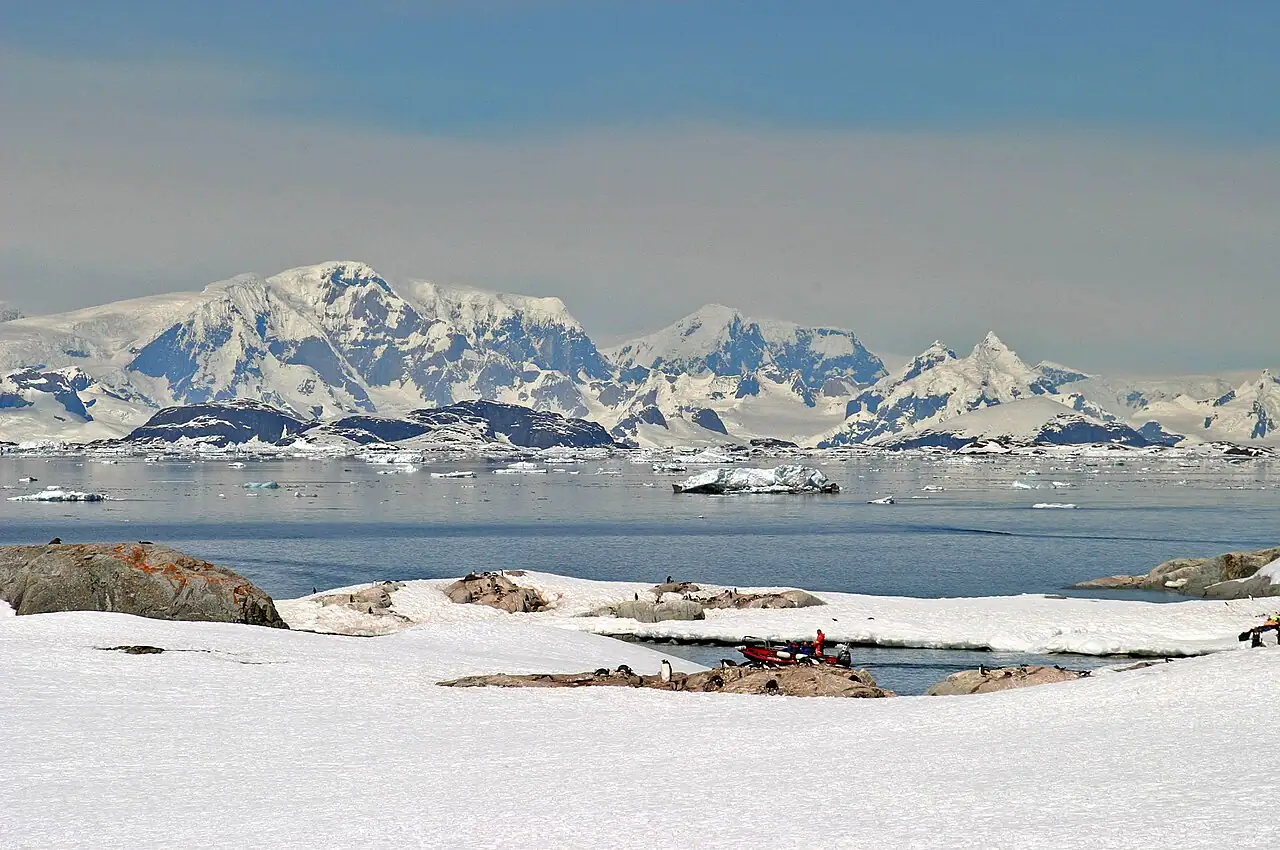
By February, penguin chicks gather in crèches, then begin molting into adult feathers, and some fledge to sea. Humpback and minke whales grow more numerous as krill swarms build, and fur seals spread along the beaches of the South Shetlands. Less sea ice lets ships explore farther south, and long, golden evenings delight photographers.
- Best time to go
- Avg high 66°F
- 14 hrs daylight
Photo: W. Bulach, CC BY-SA 4.0, via Wikimedia Commons
Antarctica in February: Best time to go
By February, penguin chicks gather in crèches, then begin molting into adult feathers, and some fledge to sea. Humpback and minke whales grow more numerous as krill swarms build, and fur seals spread along the beaches of the South Shetlands. Less sea ice lets ships explore farther south, and long, golden evenings delight photographers.
Across Antarctica cruise ports, February brings average highs around 66°F (19°C) and lows near 54°F, with about 1.8 inches of rain over the month and roughly 14 hours of daylight.
- Verdict
- Best time to go
- Season
- Late October or November to March; penguin chicks December to February, whales peak February to March.
- Average high / low
- 66°F / 54°F
- Rainfall (month)
- 1.8 in
- Daylight
- About 14 hours
- Typical cruise length
- 10 to 12 nights from Ushuaia; 18 to 23 nights with the Falklands and South Georgia
What to pack: warm-weather clothes with layers: shorts and light pants, a sweater or light jacket for breezy evenings on deck, and comfortable walking shoes.
How February compares with the rest of the year
- Jan: Best time to go
- Feb: Best time to go
- Mar: Good time to go
- Apr: No regular sailings
- May: No regular sailings
- Jun: No regular sailings
- Jul: No regular sailings
- Aug: No regular sailings
- Sep: No regular sailings
- Oct: Shoulder season
- Nov: Good time to go
- Dec: Best time to go
- No regular sailings
- Shoulder season
- Good time to go
- Best time to go
Antarctica weather in February
| Month | Jan | Feb | Mar | Apr | May | Jun | Jul | Aug | Sep | Oct | Nov | Dec |
|---|---|---|---|---|---|---|---|---|---|---|---|---|
| High °F (°C) | 6619 | 6619 | 6317 | 5814 | 5211 | 489 | 478 | 499 | 5211 | 5613 | 6116 | 6418 |
| Low °F (°C) | 5412 | 5412 | 5211 | 489 | 457 | 415 | 394 | 415 | 426 | 457 | 4910 | 5211 |
| Rain in (mm) | 1.845 | 1.846 | 2.255 | 2.153 | 2.051 | 1.845 | 1.742 | 1.744 | 1.333 | 1.435 | 1.847 | 1.742 |
| Daylight (hrs) | 15 | 14 | 13 | 11 | 9 | 9 | 9 | 10 | 12 | 14 | 15 | 16 |
February weather port by port
| Port | Avg high | Avg low | Rain | Daylight |
|---|---|---|---|---|
| Ushuaia | 55°F | 42°F | 3.0 in | 15 h |
| Stanley (Falkland Islands) | 56°F | 47°F | 1.7 in | 15 h |
| Punta Arenas | 56°F | 46°F | 1.9 in | 15 h |
| Buenos Aires | 81°F | 71°F | 3.4 in | 13 h |
| Santiago (San Antonio & Valparaíso) | 67°F | 60°F | 0.0 in | 13 h |
| Puerto Madryn | 80°F | 60°F | 0.8 in | 14 h |
Average daily highs and lows, 2015–2024, from NASA POWER, adjusted to sea level. Rain is the average monthly total.
Other great cruise destinations in February
- Caribbean in February
- Eastern Caribbean in February
- Western Caribbean in February
- Southern Caribbean in February
- Hawaii in February
- Mexican Riviera & Baja in February
- Panama Canal & Central America in February
- South America in February
- Galápagos Islands in February
- Canary Islands & Atlantic Isles in February
See every destination for February, with a port weather map →
Antarctica in February: FAQs
Is February a good time to cruise Antarctica?
Yes, it's one of the best months. By February, penguin chicks gather in crèches, then begin molting into adult feathers, and some fledge to sea. Humpback and minke whales grow more numerous as krill swarms build, and fur seals spread along the beaches of the South Shetlands. Less sea ice lets ships explore farther south, and long, golden evenings delight photographers.
What is the weather like on a Antarctica cruise in February?
Across Antarctica cruise ports, February brings average highs around 66°F (19°C) and lows near 54°F, with about 1.8 inches of rain over the month and roughly 14 hours of daylight. Conditions vary from port to port and day to day.
What should I pack for a Antarctica cruise in February?
Pack warm-weather clothes with layers: shorts and light pants, a sweater or light jacket for breezy evenings on deck, and comfortable walking shoes. Check your cruise line's dress code for evenings.
When is the best time to cruise Antarctica?
Late October or November to March; penguin chicks December to February, whales peak February to March.. The best months are usually January, February, December.
Where else can I cruise in February?
February is also a top month for Caribbean, Eastern Caribbean, Western Caribbean, Southern Caribbean, Hawaii.
Updated November 2026 by the BookMyDreamCruise editorial team. How we research and fact-check.
Sources: NASA POWER climate data.